Simplifying Complex Market Economics with Professional PowerPoint Infographics
Communicating economic principles to an audience can feel like translating a foreign language in real time. Whether you are lecturing on supply and demand elasticity, pitching a market analysis to stakeholders, or training a team on macroeconomic trends, the gap between raw data and genuine understanding is often wide. This is where a thoughtfully designed Market Economics PowerPoint Template becomes more than a visual aid — it becomes a bridge between complexity and clarity.
Why Visual Storytelling Matters in Economics
Economic concepts are inherently abstract. Ideas like fiscal policy transmission mechanisms, consumer surplus, or oligopolistic interdependence do not easily lend themselves to bullet points alone. Audiences need to see relationships, flows, and proportional changes. Infographics transform numerical abstraction into spatial logic. When a presenter uses a slide where animated elements reveal equilibrium shifts or where handmade infographics map out market structures, the cognitive load on the viewer decreases significantly. The Market Economics PowerPoint Template addresses precisely this need by packaging sophisticated economic narratives into digestible visual sequences.
Consider the last time you sat through a presentation filled with dense tables and unformatted charts. Your attention likely drifted. Now contrast that with a presentation where each concept unfolds step by step, supported by color-coded diagrams and smooth transitions. The difference is not cosmetic — it is pedagogical. Visual storytelling activates pattern recognition, making retention stronger and discussions more productive.
What the Market Economics Template Brings to Your Presentation
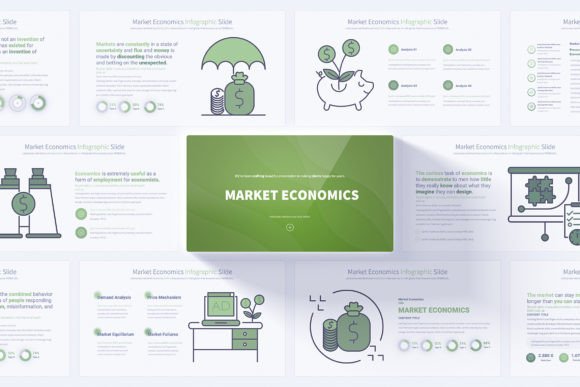
At its core, this resource consists of 17 unique slides designed specifically for market economics content. Those 17 slides expand into 204 total variations through color scheme options, giving presenters remarkable flexibility without sacrificing consistency. Every slide operates within a clean, light background environment at 16:9 Full HD resolution, ensuring that projection onto large screens or sharing via video conferencing platforms maintains crispness and professionalism.
The template includes professional opening and closing slides, which bookend presentations with polish. Rather than starting abruptly or ending awkwardly, presenters can frame their talks with structured introductions and conclusive summaries. This may seem like a small detail, but in professional and academic settings, first and last impressions carry disproportionate weight.
Handmade Infographics That Explain Rather Than Decorate
A common pitfall in presentation design is treating graphics as decoration. The handmade market economics infographics included in this template serve an explanatory function. They visualize concepts like market cycles, pricing mechanisms, competitive landscapes, and regulatory impacts through intentional design. Each element can be edited, recolored, and resized, which means the infographics adapt to your specific narrative rather than forcing your narrative to fit a rigid visual.
For example, an economist explaining monopolistic competition can use a slide that compares differentiation strategies visually. A business professional analyzing market entry barriers can animate sequential obstacles appearing on screen. The Market Economics PowerPoint Template gives these scenarios a ready-made foundation, reducing the time spent building visuals from scratch.
Understanding the 12 Color Variations and Why They Matter
Color psychology plays a significant role in how audiences process information. Warm tones can convey urgency or growth, while cooler tones suggest stability and neutrality. With 12 color variations built into the template, presenters can select palettes that align with their brand identity, institutional colors, or the emotional tone of their message. A university lecturer might choose a subdued, professional palette, while a startup founder pitching disruptive market innovation might opt for bolder, more energetic hues.
All variations maintain the light background, which improves readability in brightly lit rooms and reduces eye strain during longer sessions. The consistency of the light background across all 12 color schemes also ensures that printed handouts remain legible and that slides appear clean regardless of the display medium.
Who Benefits Most from This Resource
The Market Economics PowerPoint Template serves a remarkably diverse user base because economic communication spans many fields.
- Economists and Policy Analysts — Professionals presenting research findings, policy recommendations, or market forecasts to government bodies, think tanks, or corporate boards benefit from slides that translate complex models into accessible visuals.
- Business Professionals and Strategists — Whether conducting competitive analysis, presenting market entry strategies, or explaining pricing decisions to cross-functional teams, business users need slides that balance detail with clarity.
- Educators and Academic Researchers — From high school economics teachers to university professors, educators can use the template to standardize lecture materials, create engaging course content, and help students visualize theoretical concepts.
- Students and Graduate Researchers — Defending a thesis, presenting at a conference, or submitting a capstone project becomes easier when the visual component matches the intellectual rigor of the work.
- Consultants and Freelance Analysts — Independent professionals who deliver reports and presentations to clients can save hours of design time while maintaining a polished, credible appearance.
Slide Master Customization and Editing Efficiency
One of the more practical aspects of this template is its reliance on Slide Master for customization. Rather than editing each slide individually — a tedious and error-prone process — users can modify master slides to propagate changes across the entire deck. This feature is particularly valuable when adapting the template to organizational branding or when creating a series of presentations that must maintain visual consistency.
Simple customization extends to text, colors, shapes, and icons. The template includes a bonus set of 280 fully editable vector icons, which expands the visual vocabulary available to presenters. These icons cover a range of economic and business symbols, from currency signs and growth arrows to factory silhouettes and data nodes. Because they are vector-based, scaling them up or down never compromises quality.
Animated Elements and Smooth Transitions for Engagement
Static slides have their place, but economic storytelling often benefits from progressive revelation. Animated elements allow presenters to introduce components of a graph sequentially, building toward a conclusion rather than overwhelming viewers with a complete visual all at once. Smooth transitions between slides maintain the narrative flow, reducing the jarring jump cuts that can disrupt audience attention.
The animations included in the Market Economics PowerPoint Template are designed with restraint. They enhance rather than distract. A supply curve can shift right in response to a policy change. A pie chart segment can expand to reflect market share growth. These dynamic touches make abstract economic mechanisms feel tangible and observable.
Corporate Strategy Meetings
Imagine a quarterly strategy review where the market intelligence team presents findings on competitive dynamics. Using slides that clearly depict market concentration indices, pricing trends, and segment growth rates, the presentation shifts from dry reporting to strategic storytelling. Executives leave the room with a shared understanding of where opportunities and threats lie.
University Lectures and Seminars
An economics professor teaching international trade theory uses the template to illustrate comparative advantage, tariff impacts, and welfare effects. The handmade infographics make abstract models concrete, and the animated elements let students see equilibrium adjustments happen step by step. Course evaluations improve, and students report higher comprehension.
Client-Facing Consulting Deliverables
A management consultant delivers a market assessment to a client in the healthcare sector. The template's professional opening and closing slides frame the presentation, while the editable infographics present market sizing data, demographic trends, and regulatory considerations. The client perceives the consultant as both analytically rigorous and communicatively effective.
Investment Pitch Decks
A startup seeking Series A funding uses the template to present total addressable market analysis, competitive positioning, and go-to-market strategy. The clean design and Full HD resolution ensure that the deck looks sharp on investor screens. The color variations allow the startup to incorporate brand colors without losing the template's structural integrity.
Evaluating Suitability for Your Needs
Before adopting any presentation template, it makes sense to assess whether it aligns with your specific requirements. Here are several dimensions to consider when evaluating the Market Economics PowerPoint Template.
Content Focus: The template is purpose-built for market economics topics. If your presentation covers adjacent fields such as finance, business strategy, or public policy, it will likely serve you well. If your content is entirely unrelated — say, a medical research presentation — you may find the thematic infographics less applicable, though the structural elements and icons retain usefulness.
Software Compatibility: The template uses the PPTX format, which is compatible with Microsoft PowerPoint and most alternative presentation software. The PDF documentation included provides guidance on using and customizing the slides, which lowers the barrier for less technically inclined users.
Design Skill Level: Because customization operates through Slide Master and easily editable elements, even users with limited design experience can produce professional results. The handmade infographics are pre-built; you are not required to construct diagrams from basic shapes.
Volume and Variety: With 204 total slides spanning 17 unique layouts and 12 color schemes, the template offers enough variety to avoid visual repetition across long presentations. This breadth also supports creating multiple distinct presentations from a single resource.
Strengths and Considerations
Every tool has strengths worth highlighting and limitations worth acknowledging. The Market Economics PowerPoint Template excels in providing a structured, visually coherent framework that saves time and elevates presentation quality. The inclusion of 280 bonus vector icons, animated elements, and comprehensive documentation adds substantial value beyond the slides themselves.
One consideration is that the template's design language leans toward professional and academic settings. Presenters seeking extremely casual, whimsical, or avant-garde aesthetics may need to modify elements more extensively. Additionally, while the 12 color variations cover a broad spectrum, users with highly specific brand color requirements will need to adjust colors manually — a task made easier by Slide Master but still requiring attention to detail.
Another practical expectation involves animation. Smooth transitions and animated elements enhance live presentations, but when slides are exported to PDF or printed, these dynamic features become static. Presenters should plan for both delivery modes, ensuring that the static versions remain informative without relying on animation to convey critical information.
Making the Most of the Template in Real Projects
To maximize the value of this resource, start by mapping your key messages to the slide layouts available. Identify which infographics most closely match your economic concepts, then adapt colors and text to fit your narrative. Use the opening slide to establish context and the closing slide to reinforce your call to action or summary. Take advantage of the vector icons to annotate charts or highlight key data points.
Test your presentation in the environment where it will be delivered. Check that colors reproduce well on the projector or screen, that animations run smoothly, and that font sizes remain readable from the back of the room. Small adjustments made during rehearsal prevent larger issues during the actual presentation.
Why This Template Reflects a Broader Shift in Economic Communication
The growing availability of tools like the Market Economics PowerPoint Template reflects a broader recognition that economic literacy depends on accessible communication. Economists and business professionals are increasingly expected to engage audiences beyond their immediate peers — policymakers, journalists, community stakeholders, and students who may not share the same technical vocabulary. Templates that prioritize clarity, structure, and visual explanation support this democratization of economic knowledge.
When complex subjects find clear expression, better decisions follow. A well-presented market analysis can influence investment choices. A clearly explained economic policy can shape public opinion. A thoughtfully designed lecture can inspire the next generation of economists. The Market Economics PowerPoint Template contributes to these outcomes not by doing the thinking for you, but by giving your thinking the platform it deserves.